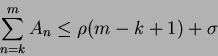
In this section we formulate a mathematical model for Internet traffic
flows which captures the flow burstiness and throughput [20],
that relate to the Maximum Burst Size (MBS) and Sustainable Cell Rate (SCR)
as the traffic descriptors at the ATM layer. More formally, the characterization
of generic variable bit rate flows has been considered in [20]:
Let ![]() be the cell arrival process in the time interval
be the cell arrival process in the time interval ![]() ,
then the cell arrival process is
,
then the cell arrival process is
![]() -constrained if
-constrained if
for all ![]() such that
such that ![]() . From equation 1 we note that
. From equation 1 we note that
![]() is the burstiness and
is the burstiness and ![]() the throughput of the stream
the throughput of the stream ![]() .
It can be shown that the arrival process
.
It can be shown that the arrival process ![]() will experience zero loss with a single server with buffer capacity
will experience zero loss with a single server with buffer capacity ![]() and
service rate
and
service rate ![]() [20].
Therefore, the flow characterization given by equation 1
can be used for resource allocation in flow-switched networks.
On the other hand, such
[20].
Therefore, the flow characterization given by equation 1
can be used for resource allocation in flow-switched networks.
On the other hand, such ![]() constrains relate
directly to the token rate and token buffer size for a leaky bucket traffic shaper.
Furthermore, a multiplex of a number of
constrains relate
directly to the token rate and token buffer size for a leaky bucket traffic shaper.
Furthermore, a multiplex of a number of ![]() -constrained
streams is also
-constrained
streams is also
![]() -constrained, being
-constrained, being ![]() and
and
![]() equal to the sum of the single connection's
equal to the sum of the single connection's ![]() and
and ![]() .
.
A most interesting feature of this model is the throughput ![]() is also an indicator of the quality of service perceived by the users
for transactional services such as the FTP or the WWW [21].
As a result we provide a TCP flow model that not only provides a flow
characterization in terms of network parameters but also serves
to the purpose of evaluating the QoS perceived by the user.
is also an indicator of the quality of service perceived by the users
for transactional services such as the FTP or the WWW [21].
As a result we provide a TCP flow model that not only provides a flow
characterization in terms of network parameters but also serves
to the purpose of evaluating the QoS perceived by the user.
Since the connection burstiness and throughput will largely depend on the TCP let us briefly describe the dynamics of such transport protocol. A TCP connection begins with a connection establishment phase in order to establish an initial sequence number and to bind the connection to a unique pair of source and destination ports. On the other hand, the transmission buffer size is negotiated between client and server. Following the connection establishment phase the connection enters slow start. The slow-start algorithm makes transmission from the server be "clocked" by ACKs from the client. Each ACK allows for a one segment increase in the transmission window until the slow start threshold is reached. From the initial exponential increase in window size a linear increase follows (each ACK produces a 1/(window size) increase). Slow start makes TCP transmission behave in a stop-and-go manner until window size reaches a value that allows for continuous transmission, even though packet loss may cause fluctuations of the transmission window. Such value depends on the buffering between client and server and can be approximated by the bandwidth-delay product of the path between client and server, namely the product of the bottleneck link bandwidth and the total roundtrip time (RTT) between client and server. For a throughout description of TCP we refer the reader to [22] and the references therein.
From the above description we note that burst size should increase geometrically
in the slow start phase, until the steady-state phase is reached.
The connection throughput grows in the same geometric fashion
(i. e. ![]() segments per RTT
segments per RTT ![]() ) until the bottleneck
link bandwidth is achieved. Nevertheless, connection throughput
depends on the link RTT and packet loss probability
[3,4,5,6,7,8,9].
On the other hand, the event that a TCP connection produces a burst of
one packet in the first RTT, two packets in the second and
so on depends on the RTT, the loss probability and the jitter
introduced in the path between client and server, that may
separate packets within bursts.
) until the bottleneck
link bandwidth is achieved. Nevertheless, connection throughput
depends on the link RTT and packet loss probability
[3,4,5,6,7,8,9].
On the other hand, the event that a TCP connection produces a burst of
one packet in the first RTT, two packets in the second and
so on depends on the RTT, the loss probability and the jitter
introduced in the path between client and server, that may
separate packets within bursts.
We note that the exact estimation of loss probability and RTT is not feasible. First, loss probability can only be estimated through duplicates of data packets or acknowledgments, but the TCP is not a selective reject protocol and will transmit more packets/ACKs than those actually lost. Secondly, estimates of the RTT based on the time difference between a packet and the corresponding ACK (like the algorithm used by TCP to set the retransmission timer values) provide very poor accuracy since TCP features like delayed ACKs make the server send one ACK per several data packets. Therefore, there is no one-to-one correspondence between a data packet and the corresponding ACK. As a conclusion, we restrict ourselves to a simple estimation of the RTT time scale in order to determine the interpacket gap within a burst.
Such RTT estimation is performed with the initial SYN-SYN handshake. Specifically, we consider the time elapsed from the detection of the SYN from the client to the first segment (ACK to the previous SYN) from the server. We note several advantages of such estimate: first, the server response time has no contribution at all in such RTT estimate since the ACK in response to the client initial SYN is sent by the TCP layer. Such server response time, which does not affect the RTT estimate, is rather significant for cold HTTP servers [23], i. e. servers being accessed from the client after an idle period. Even though there is also a cold-route effect which does affect our RTT estimate we note from [23] that the cold-server effect is significantly more important. Thus, our RTT estimate provides a RTT-interval value with minimal error. In order to further decrease estimation error a number of probe packets (ICMP echo, for instance) could be sent from the client to the server. However, such ICMP packets should be transmitted either concurrently with the TCP connection from which the RTT is to be estimated or right after connection termination since i) RTT estimation should be performed in a warm route for such connection and ii) RTTs are severely affected by time-of-day network activity so they should not be estimated ``off-line''. To summarize, our RTT estimate, while not completely accurate, provides a simple and accurate RTT-interval value estimate which suffices to slot the time axis in ``RTT-cycles''. Such normalized time axis serves to analyze and compare the dynamic behavior of a large number of TCP connections with different RTTs.
Secondly, the loss of either the SYN segment from client to server or the ACK from server to client produces a retransmission with a three seconds timer [12]. Surprisingly, we have detected retransmission timers above three seconds, depending on the TCP implementation. This timer is deterministic because there is no way for the TCP protocol agent neither at the client nor at the server side to achieve an RTT estimate at the connection setup phase. The detection of a retransmission event is thus straightforward, so that anomalous RTT estimation can be filtered out easily.
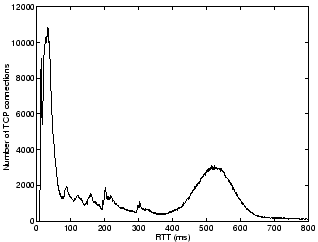
Figure 2
shows the histogram of estimated RTTs. Interestingly, we observe two RTT intervals
![]() and
and ![]() milliseconds in which the main part of the samples
are obtained. We believe that the first interval corresponds to nationwide
and European connections while the second interval corresponds to
connections to US servers. Thus, we divide the connection sample into two subsamples
according to the estimated RTT intervals, that we denote ``low RTT'' and
``high RTT'' in the remainder of this paper.
milliseconds in which the main part of the samples
are obtained. We believe that the first interval corresponds to nationwide
and European connections while the second interval corresponds to
connections to US servers. Thus, we divide the connection sample into two subsamples
according to the estimated RTT intervals, that we denote ``low RTT'' and
``high RTT'' in the remainder of this paper.
Once the RTT estimate has been defined we may proceed to the stochastic
characterization of the TCP flow. First we analyze the dynamic behavior
of the TCP flow, namely the evolution of the random variable ![]() (packets per RTT) with time
(packets per RTT) with time ![]() . Then we derive the burstiness and throughput
parameters according to equation 1.
. Then we derive the burstiness and throughput
parameters according to equation 1.