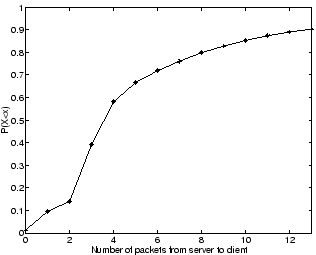
The TCP connection begins with slow start and then the steady state phase follows. In order to determine the impact of the initial TCP slow start phase in the total connection duration we first evaluate the number of packets per connection. Figure 3 shows the distribution of number of packets per TCP connection.
We note that
TCP connections are mostly short, with 80% of the connections having less than
10 packets. In order to analyze the TCP connection temporal evolution we need to examine how
these packets are distributed in the connection lifetime. For example consider a 10
packets TCP connection and recall that the variable ![]() represents the
packets per RTT
represents the
packets per RTT ![]() . In the ideal case of no packet loss and large transmission
window then
. In the ideal case of no packet loss and large transmission
window then ![]() takes on the value 1, 2, 4 in the first three RTTs, corresponding to
the slow start phase and then the value 3 corresponding to the remaining packets of
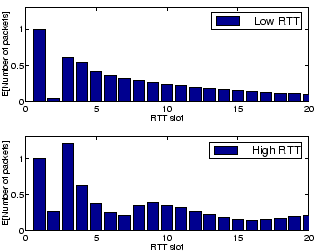
the connection in RTT 4. Figure 4 shows the average number
of packets per RTT from server to client (
takes on the value 1, 2, 4 in the first three RTTs, corresponding to
the slow start phase and then the value 3 corresponding to the remaining packets of
the connection in RTT 4. Figure 4 shows the average number
of packets per RTT from server to client (
![]() ) for connections in the ``low RTT''
and ``high RTT'' categories. We observe that the connection is active in packet transmission
in the first RTTs, corresponding to the slow start phase and then the packet generation decays with time.
On the other hand, we note a significant drop in RTT interval number two, which can
be explained with the aid of figure 8.
First, we note that 90% of TCP connections in our sample are generated
by HTTP clients. For such connections, we note that an ACK from the client to the server is sent in RTT
interval number two, followed by the HTTP GET.
Then, a file lookup time follows,
so the first data packet from the server is
likely to arrive at the client in RTT interval number three or four. This rationale
is reinforced by the fact that the server may have been accesed by the first time,
thus requiring extra time in order to issue a response to the GET PDU [23].
) for connections in the ``low RTT''
and ``high RTT'' categories. We observe that the connection is active in packet transmission
in the first RTTs, corresponding to the slow start phase and then the packet generation decays with time.
On the other hand, we note a significant drop in RTT interval number two, which can
be explained with the aid of figure 8.
First, we note that 90% of TCP connections in our sample are generated
by HTTP clients. For such connections, we note that an ACK from the client to the server is sent in RTT
interval number two, followed by the HTTP GET.
Then, a file lookup time follows,
so the first data packet from the server is
likely to arrive at the client in RTT interval number three or four. This rationale
is reinforced by the fact that the server may have been accesed by the first time,
thus requiring extra time in order to issue a response to the GET PDU [23].
Besides, we note that high-RTT connections show higher variability in the packet generation process due to the larger number of hops from client to server, which makes connection evolution more unpredictable. Overall, the results suggest that the transmission window does not reach the steady-state but rather the most part of the packets are transmitted in the initial RTTs, while the few packets remaining are transmitted in subsequent RTTs.
The results from this subsection show that connections are mostly short and the packet arrival process is dictated by the initial slow start phase. We now turn our attention to the TCP connections throughput and burstiness characterization, that is presented next.