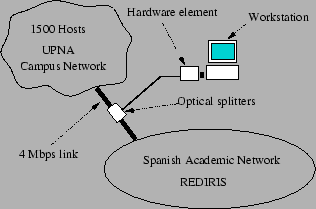
Our traffic traces are obtained from the network configuration depicted in figure 1. The measurements are performed at the ATM PVC that links Public University of Navarra to the core router of the Spanish academic network (RedIris 1) in Madrid. Rediris topology is a star of Permanent Virtual Circuits (PVCs) which connect the Universities around the country to the central interconnection point in Madrid. From the central RedIris facilities in Madrid a number of international links connect the Spanish ATM academic network to the outside Internet. The measured PVC is terminated at both sides by IP routers. The Peak Cell Rate (PCR) of the circuit is limited to 4 Mbps and the transmission rate in the optical fiber is 155 Mbps.
We note that the scenario under analysis is a representative example of a number of very common network configurations. For example, a number of Spanish Internet Service Providers (ISPs) hire ATM PVC links to the operator in order to provide customers with access to the Internet. The same situation arises with corporate and academic networks, that are linked to the Internet through such IP over ATM links. On the other hand, our measurements are not constrained by a predetermined set of destinations but they constitute a real case of a very large sample of users accessing random destinations in the Internet. Furthermore, we carefully check the ATM PVC utilization factor and note that it never reaches 50% during the measurement campaign of one week. This sanity check is performed to ensure that the present analysis accurately portrays a general Internet case. Namely, different connections are facing different bottleneck links according to the destination, but the results are not correlated by a potential bottleneck link in the access. Finally, the wealth of data in the trace provides a strong confidence level in the obtained results. Table 1 summarizes the main characteristics of the traffic trace presented in this paper.
Our measurement tool is implemented with a dedicated hardware to avoid packet filters
effects, that can produce measurement skews as noted in [19]. Measurements
are performed on-line instead of collecting a trace at the ATM or IP level and
performing off-line analysis. The advantage of this technique is that a large amount
of data can be analyzed without interruption since measurements are not so storage-intensive.
The dedicated hardware performs extraction of the IP and transport protocol headers, both TCP and UDP.
Furthermore, the timestamp resolution for the IP datagram and the ATM cell is 14/12 ![]() The offered traffic that can be supported with no cell loss
is 300 Mbps. The dedicated hardware relays headers to a UNIX workstation that performs
analysis using UNIX threads. One of the major advantages for using threads instead of
concurrent processes (namely, processes created with a fork system call) is interprocess
communication. While the latter may require multiple copies of packet headers in kernel memory
the former share the same address space. Therefore, a large throughput between the different
threads can be achieved. As a result, a number of threads can be spawned to perform different
functions such as TCP connection tracking. Indeed, the measurement tool is able to track the
active TCP connections, allowing for a detailed analysis of TCP services, even in high speed
environments.
The offered traffic that can be supported with no cell loss
is 300 Mbps. The dedicated hardware relays headers to a UNIX workstation that performs
analysis using UNIX threads. One of the major advantages for using threads instead of
concurrent processes (namely, processes created with a fork system call) is interprocess
communication. While the latter may require multiple copies of packet headers in kernel memory
the former share the same address space. Therefore, a large throughput between the different
threads can be achieved. As a result, a number of threads can be spawned to perform different
functions such as TCP connection tracking. Indeed, the measurement tool is able to track the
active TCP connections, allowing for a detailed analysis of TCP services, even in high speed
environments.
We note that a similar hardware/software approach to perform analysis of large volumes of data is adopted in [1]. However, only connection records are provided by the on-line analyzer presented in [1] (OC3MON) whereas our network monitor records the first 100 packets headers of each TCP connection, thus allowing for a more detailed analysis at the packet level, while keeping the storage requirements at a minimum for long term analysis without interruption. More importantly, a significant advantage of our monitoring tool with respect to OC3MON is that TCP connection teardown is not detected by timeout (64 s.) but the TCP state of every single connection that is captured by the monitor is tracked in real time, according to the TCP segments that are read from the network. Thus, connection establishment and teardown instants are recorded with better accuracy, allowing for a more detailed examination of network parameters such as burstiness and throughput.