Connection throughput can be derived simply by the ratio between the transfered bytes and the duration. We distinguish between total duration and duration of the data transfer phase. The former is related to the actual QoS perceived by the user, since it takes into account the time elapsed from the user request to the end of the connection. The latter is the actual connection mean offered traffic to the ATM link. On the other hand, the burst size evaluation requires a threshold for the packet interarrival time in order to determine whether subsequent packets belong to the same burst. Such threshold can be derived easily with the peak rate of the link. Since intra-burst transmission takes place at the peak rate we first consider that several packets belong to the same burst if they are transmitted at the peak rate. Interestingly, we find no bursts of packets belonging to the same connection at the peak rate in the measurement period.
We note that bursts within TCP connections depend heavily on the
path between the server and the client and the TCP dynamics. First,
the network induced jitter may separate packets belonging to the same
burst. Secondly and most importantly, since TCP connections are short
in size a significant portion of the connection lifetime
is devoted to slow start, that produces bursts of geometrically increasing size,
namely ![]() packets per RTT round
packets per RTT round ![]() . A typical TCP connection
is expected to produce a burst of one packet, followed
by an inactivity interval of roughly one RTT, then a two packets
burst, with a packet interarrival time that is determined by
the bottleneck link bandwidth and the jitter induced by the network.
. A typical TCP connection
is expected to produce a burst of one packet, followed
by an inactivity interval of roughly one RTT, then a two packets
burst, with a packet interarrival time that is determined by
the bottleneck link bandwidth and the jitter induced by the network.
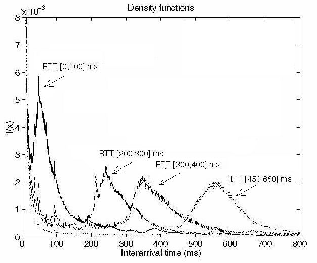
This can be clearly observed in figure 5 that shows the histogram of packet interarrival times within connections. We observe low packet interarrival times that correspond to packets within the same burst and packet interarrival times in the vicinity of the RTT value, corresponding to packets in different bursts. Figure 5 provides a threshold for packet interarrival times within a burst. Specifically, We choose a value of 20 milliseconds as the upper bound for the packet interarrival time within the burst. The burstiness derived with this method is always higher than the burstiness derived with the ATM link peak rate, so it provides a safe upper bound for dimensioning purposes.
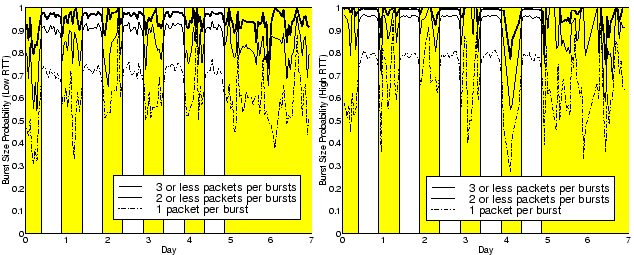
Figure 6 shows the connection burstiness
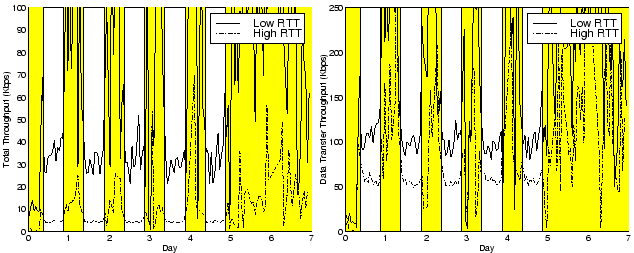
according to this criteria and figure 7
shows the throughput. The shaded areas correspond to night
and weekend measurement intervals, in which the observed
traffic is much lower. Figure 7 shows the
throughput in hourly intervals and figure 6
shows the probability of ![]() packets per burst also in
hourly intervals, where
packets per burst also in
hourly intervals, where ![]() .
.
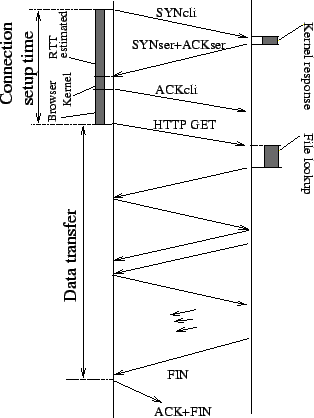
Figure 7 shows that the user-perceived throughput, namely the ratio between the bytes transfered and the total duration decreases significantly in comparison to the data transfer throughput. In order to analyze such performance drop, figure 8 shows the connection establishment phase duration in comparison to the data transfer phase duration. The connection establishment time is defined as the time interval from connection initiation (SYN) issued by the client till the connection is in established state in the client side and the first data packet is sent to the server, normally a file request. For the WWW service (90% of our connection sample), such first data segment is the HTTP GET request issued from client to server. Interestingly, the connection setup time does not include the file lookup time in the server, that would presumably take a significant part of connection duration. Even though such lookup time is not included we note two contributions to connection setup delay: First, the URL submission from the client to the server. Secondly, packet loss in connection establishment phase translates into considerable delay since the TCP retransmission timer takes on high values in the connection establishment phase (in the order of seconds) until more RTT samples are received. Furthermore, the impact of the connection establishment phase is significant since connections are short in duration.
On the other hand, the results in figure 6 show a very low connection burstiness (roughly 95% of bursts contain less than 2 packets) and suggests that a small buffer should be enough to provide zero loss in the link. Indeed, we perform on-line simulations of the ATM link under different shaping conditions and verify this hypothesis. We note that the most TCP connections do not reach the steady state phase and, thus, produce short bursts due to slow start, that are also affected by the jitter and loss induced by the network.